
- Our Article
Fleet Idle Time : How Telematics Helps Reduce Fuel Waste and Engine Hours
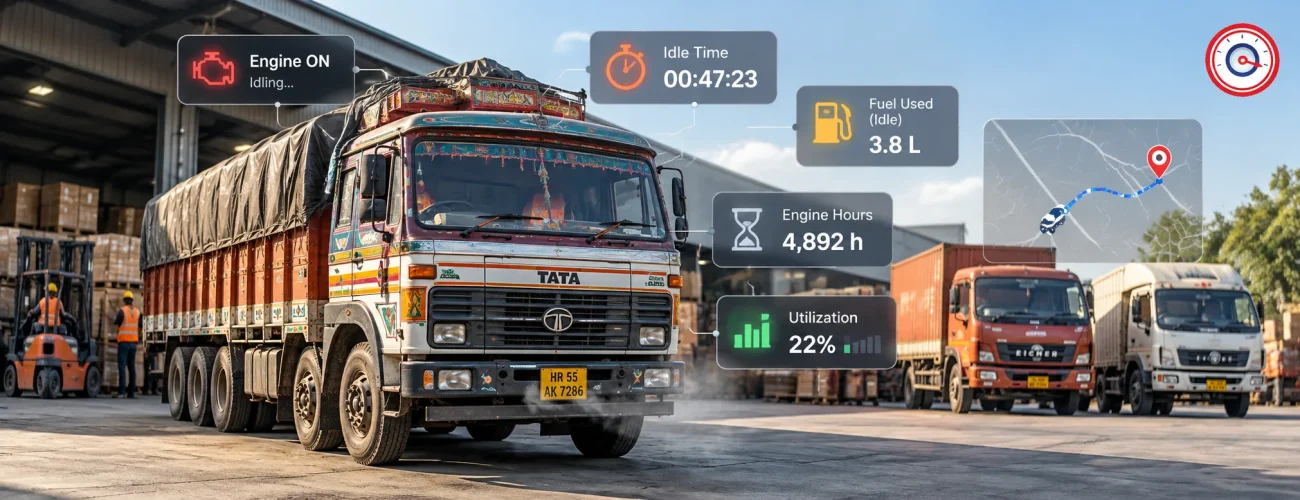
A truck can be stationary and still cost the fleet money.When an engine keeps running during loading delays, driver breaks, depot waiting, customer queues or other non-productive stops, fuel continues to be consumed even though the vehicle is not covering useful distance. At the same time, engine operating hours continue to accumulate.Across a commercial fleet, those small periods can become a significant operational pattern.
Fleet idle time monitoring helps operators understand when vehicles remain stationary with the engine running, where it happens, how long it lasts and whether the idling is actually necessary.Modern telematics makes this easier by combining ignition or engine status with GPS movement, trip information and—in compatible vehicles—CAN Bus or PTO data.The objective is not to eliminate every idle event. Some vehicles need to remain running to operate refrigeration, hydraulic systems, pumps or other equipment.
The real opportunity is to identify avoidable idling without confusing it with productive work.
Fleet Idle Time at a Glance
- Idle time generally means the engine is running while the vehicle remains stationary.
- Telematics can identify idle events using engine or ignition status plus vehicle movement.
- Fleet managers can compare idle hours by vehicle, route, driver, site or shift.
- PTO or auxiliary-equipment data can help separate productive stationary work from discretionary idling.
- Excessive unnecessary idling can increase fuel consumption and engine operating hours.
- Location analysis can reveal warehouse, loading, dispatch or customer-process problems.
- The best idle policy varies by vehicle type and operating environment.
- Idle data is most useful when combined with fuel, GPS, maintenance and operational information.
What Is Fleet Idle Time?
Fleet idle time is the period when a vehicle’s engine remains running while the vehicle is stationary or not producing useful road movement.
Typical examples include:
- Waiting outside a warehouse
- Queueing for loading or unloading
- Standing at a customer location
- Driver breaks with the engine running
- Waiting for dispatch instructions
- Long depot stops
- Construction-site queues
- Bus terminal waiting
- Traffic-related stationary periods
However, stationary does not automatically mean wasteful.
A tipper may need engine power for hydraulics. A refrigerated vehicle may require auxiliary equipment. A tanker or service vehicle may use equipment while parked.
This distinction is essential because a useful fleet idle strategy should identify unnecessary engine-on time, not simply punish every stationary event.
Why Fleet Idle Time Matters
Idle time connects several parts of fleet management that are often reviewed separately.
Fuel Is Consumed Without Productive Distance
An operating engine continues using fuel even when the vehicle is not travelling.
The U.S. Department of Energy uses approximately 0.8 US gallons per hour—about 3 litres per hour—as a reference value for heavy-duty diesel truck idling. That figure should be treated as a benchmark rather than an assumed rate for Indian commercial vehicles because actual consumption varies with engine size, load, climate-control use, PTO operation and vehicle configuration.
This is why Diselmap fleets should ideally calculate idle cost using their own measured fuel data, not a generic industry average.
A Fuel Management System can provide additional context when investigating how stationary engine operation contributes to overall vehicle fuel consumption.
Engine Hours Continue Even When Kilometres Do Not
A vehicle’s odometer measures distance.
It does not tell you how long the engine has been operating.
Imagine two vehicles that each travel 6,000 km during a month.
One accumulates relatively little idle time. The other spends many hours waiting with the engine running.
Their mileage looks similar, but their engines have experienced different operating time.
That is why fleets with significant stationary operation should consider:
Distance + engine hours + idle hours
rather than looking only at kilometres.
Unnecessary Idling Can Add Engine Wear
The U.S. Department of Energy notes that unnecessary idling wastes fuel and contributes to engine wear, while reducing idle time can lower associated maintenance costs, particularly for heavy-duty trucks.
For fleet managers, this does not mean idle hours alone should determine maintenance schedules.
Instead, engine and idle hours can provide additional context alongside:
- Manufacturer service intervals
- Kilometres travelled
- Operating environment
- Vehicle age
- Maintenance history
- Engine condition
This makes idle information relevant to fleet preventive maintenance as well as fuel management.
Necessary Idling vs Avoidable Idling
A strong idle-monitoring program starts by separating productive stationary operation from discretionary engine-on time.
| Idle Situation | Typical Classification | What Fleet Managers Should Do |
|---|---|---|
| Hydraulic equipment operating | Productive | Record separately where possible |
| Refrigeration or auxiliary equipment required | Operational | Confirm equipment requirement |
| Short loading queue | Operational | Monitor duration and frequency |
| Heavy traffic | Route-related | Analyse route and time of day |
| Long driver break with engine running unnecessarily | Potentially avoidable | Review and coach |
| Vehicle waiting after work is completed | Potentially avoidable | Investigate workflow |
| Multiple trucks idling at same warehouse | Process-related | Investigate the location |
| PTO-powered equipment operating | Productive | Exclude from avoidable-idle reporting where possible |
This distinction prevents an important mistake:
A stationary engine is not always an inefficient engine.
How Telematics Detects Fleet Idle Time
Fleet telematics converts engine-on stationary periods into measurable events.
The exact logic depends on the vehicle, hardware and platform, but a common process looks like this.
1. The System Identifies Engine or Ignition Status
A telematics device first determines whether the vehicle is operating.
Depending on the installation, this information may come from:
- Ignition wiring
- Engine data
- CAN Bus
- OEM vehicle data
- Other connected inputs
2. GPS Confirms Whether the Vehicle Is Moving
The system compares engine status with GPS-derived vehicle movement.
A potential idle event can be identified when:
Engine/ignition = ON
Vehicle speed = stationary or near zero
Condition continues beyond a defined threshold
A threshold is useful because stopping briefly at a signal should not necessarily be treated the same as sitting for 25 minutes with the engine running.
3. The Event Receives Context
A useful idle record may include:
- Vehicle
- Start time
- End time
- Idle duration
- GPS location
- Trip
- Route
- Driver, where identified
- Engine information
- PTO state, where available
This is where Telematics Solutions add value beyond a basic location dot on a map.
4. Fleet Managers Analyse Patterns
One idle event tells you what happened once.
Thirty days of idle data can tell you how the fleet operates.
Managers can compare:
- Vehicle vs vehicle
- Route vs route
- Driver vs driver
- Customer vs customer
- Depot vs depot
- Day shift vs night shift
- Week vs week
That makes idle monitoring an operational-analysis tool rather than simply another alert.
Why PTO Separation Matters
One of the most important improvements in idle analysis is distinguishing normal engine idling from engine-powered work.
PTO stands for Power Take-Off.
Commercial vehicles may use PTO or other auxiliary systems to operate equipment such as:
- Hydraulic pumps
- Tipper bodies
- Cranes
- Tanker pumps
- Utility equipment
- Other body-mounted machinery
Consider a vehicle that remains stationary for 45 minutes with the engine running.
A basic report might classify all 45 minutes as idle time.
But if the engine was powering hydraulic equipment during that period, the vehicle may have been performing productive work.
Where the vehicle and telematics integration support it, PTO or auxiliary-status data can help fleets distinguish:
Stationary + engine on + PTO active → productive operation
from:
Stationary + engine on + no productive activity → potential avoidable idling
This produces fairer reporting and prevents legitimate work from being treated as driver waste.
GPS Tracking vs Idle-Time Monitoring
GPS and idle monitoring are related, but they answer different questions.
A GPS Tracking System primarily answers:
Where was the vehicle and where did it travel?
Idle monitoring adds another question:
Was the engine running while the vehicle remained there?
Consider a truck spending 50 minutes at a distribution centre.
GPS alone may show a 50-minute stop.
Idle data can reveal whether the engine:
- Was switched off for almost the entire stop
- Ran for only five minutes
- Remained on throughout the full 50 minutes
Those scenarios have very different fuel and operational implications.
Where Avoidable Fleet Idling Often Happens
The most valuable idle report may not be a driver ranking.
It may be a location report.
Warehouses and Distribution Centres
Repeated idling can occur while vehicles wait for:
- Security clearance
- Dock assignment
- Loading
- Unloading
- Documentation
- Dispatch approval
If several drivers show the same pattern at one facility, coaching individual drivers may not solve the problem.
The real issue may be warehouse workflow.
Construction Sites
Construction vehicles may spend time:
- Waiting to load
- Waiting for excavators
- Queueing to unload
- Waiting for site clearance
- Operating hydraulics
- Repositioning between work cycles
This makes construction fleets a good example of why PTO and operational context matter.
Urban Delivery Routes
Delivery fleets may experience stationary time because of:
- Congestion
- Customer access
- Loading zones
- Delivery paperwork
- Parking limitations
- Driver breaks
Managers should separate unavoidable city conditions from genuinely unnecessary idling.
Bus and Passenger Fleets
Idle events may occur at:
- Terminals
- Scheduled stops
- Depots
- Passenger waiting points
Schedule design and climate requirements may affect what constitutes acceptable idling.
Tankers and Specialised Fleets
Tankers and service vehicles may need stationary engine power for equipment.
Their idle policies should therefore differ from those of ordinary logistics trucks.
How Telematics Helps Reduce Fuel Waste from Idling
Telematics does not save fuel simply because it is installed.
It provides the information needed to make better operational decisions.
Identify High-Idle Vehicles
Fleet managers can compare similar vehicles and identify unusual patterns.
Suppose twelve trucks perform comparable work but two consistently record much higher non-PTO idle time.
That creates a useful investigation point.
Possible causes include:
- Driver habits
- Route differences
- Customer waiting
- Mechanical operation
- Dispatch timing
- Air-conditioning use
- Different work assignments
The dashboard identifies the exception.
The fleet manager identifies the reason.
Find High-Idle Locations
This can be even more valuable than identifying drivers.
For example:
Six vehicles repeatedly record long idle events at Warehouse B between 3 PM and 6 PM.
That finding may lead to operational changes such as:
- Revised appointment slots
- Better dock planning
- Faster gate processing
- Different dispatch times
- Improved customer coordination
Reducing waiting may improve both fuel efficiency and vehicle utilisation.
Use Alerts Carefully
Some telematics platforms can notify fleet teams when a stationary engine-on event exceeds a defined threshold.
Thresholds should be meaningful.
An alert for every short stop may create unnecessary noise.
A better configuration considers:
- Vehicle type
- Route
- Work activity
- PTO status
- Normal operating requirements
For example, a delivery van and hydraulic tipper should not necessarily use the same rule.
Coach Drivers with Specific Evidence
Generic instructions such as:
“Stop idling so much.”
are difficult to act on.
Data-based coaching is clearer:
“This vehicle recorded three engine-on stops longer than 20 minutes after returning to the depot last week.”
Where appropriate, idle-event information can complement driver behavior monitoring by giving supervisors specific operating context.
Fleet Idle Time Is Not Only a Driver Issue
This point deserves emphasis.
Poor idle performance can be caused by fleet operations, not driver behaviour.
Examples include:
- Vehicles dispatched too early
- Slow gate processing
- Poor loading coordination
- Customer delays
- Congested depots
- Repeated route bottlenecks
- Lack of parking procedures
- Long paperwork processes
If ten different drivers experience the same long idle event at one location, replacing or coaching the drivers will probably not solve the underlying problem.
A good fleet idle program asks:
Who?
Which vehicle or driver?
Where?
At which location?
When?
During which shift or route?
How long?
What was the duration?
Why?
What operational activity caused it?
The final question is where actual improvement begins.
Useful Fleet Idle-Time KPIs
Fleet managers do not need dozens of idle metrics.
A focused set is usually more useful.
Total Idle Hours
Track total engine-on stationary time by:
- Vehicle
- Driver
- Depot
- Route
- Shift
- Fleet
Avoidable Idle Hours
Where enough operational data exists, separate potentially avoidable events from:
- PTO operation
- Refrigeration requirements
- Known work activity
- Other approved stationary operation
This metric is usually more actionable than total idle time.
Idle Percentage
A useful normalized metric is:
Idle Percentage = Idle Hours ÷ Engine-On Hours × 100
This makes comparisons between differently utilised vehicles more meaningful.
Average Idle Event Duration
A fleet with many two-minute events has a different problem from one with repeated 40-minute events.
Average event duration helps reveal the pattern.
Idle Events per Vehicle
Event frequency helps identify repetitive behaviour.
Idle Time by Location
This helps uncover site-level bottlenecks.
Idle Trend Over Time
Compare weekly or monthly results to determine whether operational changes are working.
Idle metrics can sit alongside broader fleet management KPIs rather than becoming a separate reporting system.
How to Calculate the Cost of Fleet Idling
Avoid relying on an online statement such as:
“Every truck wastes ₹X per year.”
The amount varies too much between vehicles and fleets.
A better approach uses your own operating data.
Step 1: Determine Avoidable Idle Hours
Example:
Avoidable idle hours per month = 180 hours
Step 2: Measure or Estimate Idle Fuel Consumption
Use actual fleet data where possible.
Example:
Measured idle consumption = 2.4 litres/hour
Step 3: Calculate Idle Fuel Used
Idle Fuel Used = Avoidable Idle Hours × Fuel Used per Idle Hour
Using the example:
180 × 2.4 = 432 litres
Step 4: Apply Your Actual Diesel Cost
Idle Fuel Cost = Idle Fuel Used × Fuel Price
This allows the fleet to update the calculation whenever fuel prices change.
Step 5: Scale Across Vehicles
For a large fleet:
Fleet Idle Cost = Sum of avoidable idle fuel cost across relevant vehicles
This provides a more defensible number than applying a generic international estimate to every Indian truck.
A Better Way to Set Idle Thresholds
There is no universal rule such as:
“Every vehicle must switch off after exactly three minutes.”
Fleet operations are too different.
Instead, use tiered thresholds.
Delivery Vehicles
Review:
- Customer stops
- Urban congestion
- Driver breaks
- Loading-zone waiting
Highway Trucks
Review:
- Depot waiting
- Rest stops
- Toll/queue behaviour
- Loading and unloading
Construction Vehicles
Account for:
- PTO
- Hydraulics
- Equipment waiting
- Work cycles
Refrigerated Fleets
Consider:
- Cargo requirements
- Separate refrigeration units
- Temperature-control procedures
A useful policy is one that drivers can realistically follow without interfering with legitimate work.
How Fuel Monitoring Adds Context
Telematics may show when a vehicle idled.
Fuel monitoring can help determine what happened to fuel during the same operating period.
Reviewing both can help fleet managers investigate:
- High fuel use during long stops
- Unexpected differences between similar vehicles
- Route-level fuel behaviour
- Refuelling around extended stationary periods
- Repeated high-idle/high-consumption patterns
The goal is not to assume every fuel decrease during an idle event represents waste.
The value comes from having more context.
How CAN Bus Data Improves Idle Analysis
On compatible vehicles, CAN Bus monitoring may provide information such as:
- Engine RPM
- Vehicle speed
- Engine hours
- Engine load
- Fuel-related parameters
- PTO-related data
- Other ECU information
This can improve classification.
For example, two events may both show:
Vehicle speed: 0 km/h
But one may have:
Low engine load + no PTO
while another has:
PTO active + increased engine load
Those events should not necessarily be treated the same.
Availability depends on the vehicle, ECU, telematics hardware and integration.
Fleet Idle Time and Cost Per Kilometer
Mileage-based cost analysis can hide idle behaviour.
Suppose two trucks each travel 8,000 km in one month.
Truck A has low avoidable idle time.
Truck B spends many additional hours stationary with the engine operating.
Even though the distance is identical, their fuel and operating costs can differ.
This is why idle information can add useful context when reviewing fleet cost per kilometer.
Distance tells you how far the asset travelled.
Idle and engine-hour data help explain how the asset operated while delivering that distance.
Fleet Idle Time and Preventive Maintenance
Vehicles with high stationary engine operation create an important maintenance question:
Is mileage alone accurately representing vehicle usage?
For some fleet applications, the answer may be no.
Maintenance teams can review:
- Kilometres
- Engine hours
- Idle hours
- PTO hours
- Vehicle age
- Operating environment
- Service history
These signals provide useful context, but they should not replace manufacturer-recommended maintenance schedules.
The correct approach is to use telematics to support maintenance decisions—not invent new service intervals without technical justification.
A Practical 30-Day Fleet Idle Reduction Plan
Week 1: Establish the Baseline
Pull the previous 30 days of data.
Measure:
- Total idle hours
- Idle hours by vehicle
- Longest events
- Most frequent locations
- Idle percentage where available
Do not change policy yet.
Understand the current pattern first.
Week 2: Classify the Idling
Separate events into categories such as:
- Necessary
- PTO-related
- Traffic-related
- Customer delay
- Depot delay
- Driver-related
- Unknown
The unknown category is useful because it prevents managers from guessing.
Week 3: Address the Largest Causes
Do not try to solve everything simultaneously.
If the biggest problem is one warehouse, fix that workflow.
If the biggest problem is a small group of vehicles, investigate those assets.
If the problem is driver behaviour, start targeted coaching.
Week 4: Compare the Change
Review:
- Avoidable idle hours
- Idle percentage
- High-idle locations
- Fuel usage
- Repeated events
Then continue monitoring the trend rather than treating idle reduction as a one-time project.
Common Fleet Idle-Time Mistakes
Treating Every Idle Minute as Waste
This creates inaccurate reporting and frustrates drivers performing legitimate work.
Using One Threshold Across the Entire Fleet
Vehicle roles differ too much for a universal rule.
Ranking Drivers Without Context
A city-delivery driver and long-haul highway driver may experience completely different operating conditions.
Ignoring PTO Activity
This can make productive work look like unnecessary idling.
Looking Only at Monthly Totals
A total such as “500 idle hours” is not actionable.
You need to know where, when and why.
Sending Too Many Alerts
Constant notifications eventually get ignored.
Prioritize meaningful exceptions.
Focusing Only on Fuel
Idle analysis can also reveal:
- Process delays
- Underutilization
- Poor scheduling
- Maintenance context
- Customer bottlenecks
Collecting Data Without Changing Operations
Reports do not save fuel.
Operational decisions do.
Can Fleet Idle Time Be Reduced to Zero?
For most commercial fleets, zero idle time is neither realistic nor desirable.
Vehicles may need stationary engine operation because of:
- Traffic
- Safety
- Weather
- PTO
- Refrigeration
- Hydraulic equipment
- Passenger requirements
- Job-site work
The more useful target is:
Reduce avoidable idle time without disrupting necessary fleet operations.
That creates a much more practical management objective.
How Diselmap Helps Fleets Understand Idle Behaviour
Diselmap helps commercial fleet operators connect location, vehicle and operational information so fleet managers can understand not only where vehicles travel but also how they are being used.
Depending on the vehicle, installed hardware and available integrations, connected fleet data can support visibility into areas such as:
- Vehicle location
- Trips
- Ignition status
- Stops
- Idle events
- Engine hours
- Driver activity
- Fuel information
- CAN Bus data
- Vehicle operating patterns
This helps fleet managers move beyond:
“Why is our fuel bill increasing?”
toward more specific questions:
“Which vehicles have the highest avoidable idle time?”
“Where are our trucks waiting with engines running?”
“Is that idling necessary for the job?”
“Is one customer location creating repeated delays?”
“Are engine hours unusually high compared with kilometres?”
Those questions produce more actionable fleet decisions.
Frequently Asked Questions
What is fleet idle time?
Fleet idle time is the period when a vehicle’s engine remains running while the vehicle is stationary or not producing useful movement.
How does telematics detect vehicle idling?
Telematics can combine ignition or engine status with GPS movement. If a vehicle remains stationary with the engine running beyond a defined threshold, the system can record an idle event.
Does idling waste fuel?
Yes. An engine continues consuming fuel while running. Whether that fuel use is avoidable depends on why the vehicle is idling.
How much fuel does a truck use while idling?
Fuel consumption varies by vehicle, engine size, load and operating conditions. Fleets should use their own measured data wherever possible rather than relying only on generic averages.
What is the difference between productive idling and unnecessary idling?
Productive idling supports real work such as hydraulics, refrigeration, pumps or PTO equipment. Unnecessary idling is engine-on stationary time that does not support productive activity.
Can fleet idle time increase engine hours?
Yes. Engine operating hours continue to accumulate whenever the engine is running, even if the vehicle is not travelling.
How can fleet operators reduce unnecessary idling?
Fleet managers can track idle events, identify high-idle vehicles and locations, separate necessary from avoidable idling, coach drivers and improve operational processes such as loading, dispatch and scheduling.
Can idle-time data help reduce fleet fuel costs?
Yes. By identifying and reducing avoidable engine-on stationary time, fleets can reduce fuel consumed during those events and improve overall fuel-use visibility.
Conclusion
Fleet idle time is not just a fuel issue. It can also reveal unnecessary engine hours, repeated waiting, driver habits, loading delays and operational bottlenecks.
The most effective approach is to measure idle events, separate necessary work from avoidable idling, identify recurring patterns and act on the root cause.
With telematics, GPS, engine data and fuel information working together, fleet managers can better understand where idle time is happening and whether it is caused by the vehicle, driver, route or operation.
The goal is not to eliminate every idle event. It is to reduce avoidable idling while keeping fleet operations productive and practical.
Resources
- U.S. Department of Energy – Idle Reduction Basics: supports the general point that idling wastes fuel and increases engine wear.
DOE Idle Reduction Basics - U.S. Department of Energy – Heavy-Duty Truck Idle Reduction: useful for heavy-truck idle reduction context and savings calculations.
DOE Heavy-Duty Truck Idle Reduction - EPA SmartWay – Idle Reduction: supports the broader fuel, emissions and operating-cost benefits of reducing unnecessary truck idling.
EPA SmartWay Idle Reduction - For an India-specific reference, you can cite the Government of India/PCRA fuel-conservation campaign, which documented reduced idling fuel losses after anti-idling awareness measures.
PIB Fuel Conservation Campaign
Reduce Fleet Idle Time with Better Visibility
Identify unnecessary engine-on time, understand where vehicles are waiting, and separate productive operations from avoidable idling with connected fleet data. Diselmap helps fleet teams combine GPS tracking, telematics, engine information and fuel monitoring to analyse idle patterns more clearly. Use these insights to improve driver coaching, investigate operational delays, control fuel waste and support better maintenance decisions across your fleet.