
- Our Article
Petrol, Diesel & CNG Prices in India 2026: 5-Year Trend, Rising Costs and Fleet Solutions
Fuel remains one of the most important operating costs for road transport businesses in India.For an individual vehicle owner, a change of a few rupees per litre may affect the monthly fuel budget. For a commercial fleet purchasing hundreds or thousands of litres every day, the same price movement can influence cost per kilometre, route profitability, customer pricing and overall operating margins.India’s fuel market over the past five years also shows why fleet businesses cannot assume that petrol, diesel or CNG costs will remain stable indefinitely.
Delhi petrol was ₹110.04 per litre and diesel ₹98.42 per litre in November 2021. Following tax reductions and later retail-price adjustments, Delhi prices moved lower over the following years before rising again during 2026.At the same time, international energy markets experienced another major period of volatility. In March 2026, the Government of India reported that international crude prices had moved from around $70 per barrel to approximately $122 per barrel in less than four weeks amid disruption to global energy supplies.
For fleet operators, the important distinction is simple:The market determines what fuel costs. Fleet operations determine how efficiently that fuel is used.That is where fuel monitoring, GPS tracking, telematics and better vehicle-level data become valuable.
Quick Answer
Petrol, diesel and CNG prices in India are influenced by international energy prices, currency movements, central duties, state taxes, dealer and distribution costs, and domestic pricing conditions.
Commercial fleets cannot control international crude oil prices or taxation. They can, however, influence many of the operational factors that determine how much fuel is consumed.
These include:
- Idle time
- Unnecessary kilometres
- Route efficiency
- Refuelling activity
- Driver behaviour
- Vehicle condition
- Fuel-level changes
- Vehicle utilization
- Fuel cost per kilometre
For fleet managers, controlling these factors can become increasingly important when fuel prices remain high or volatile.
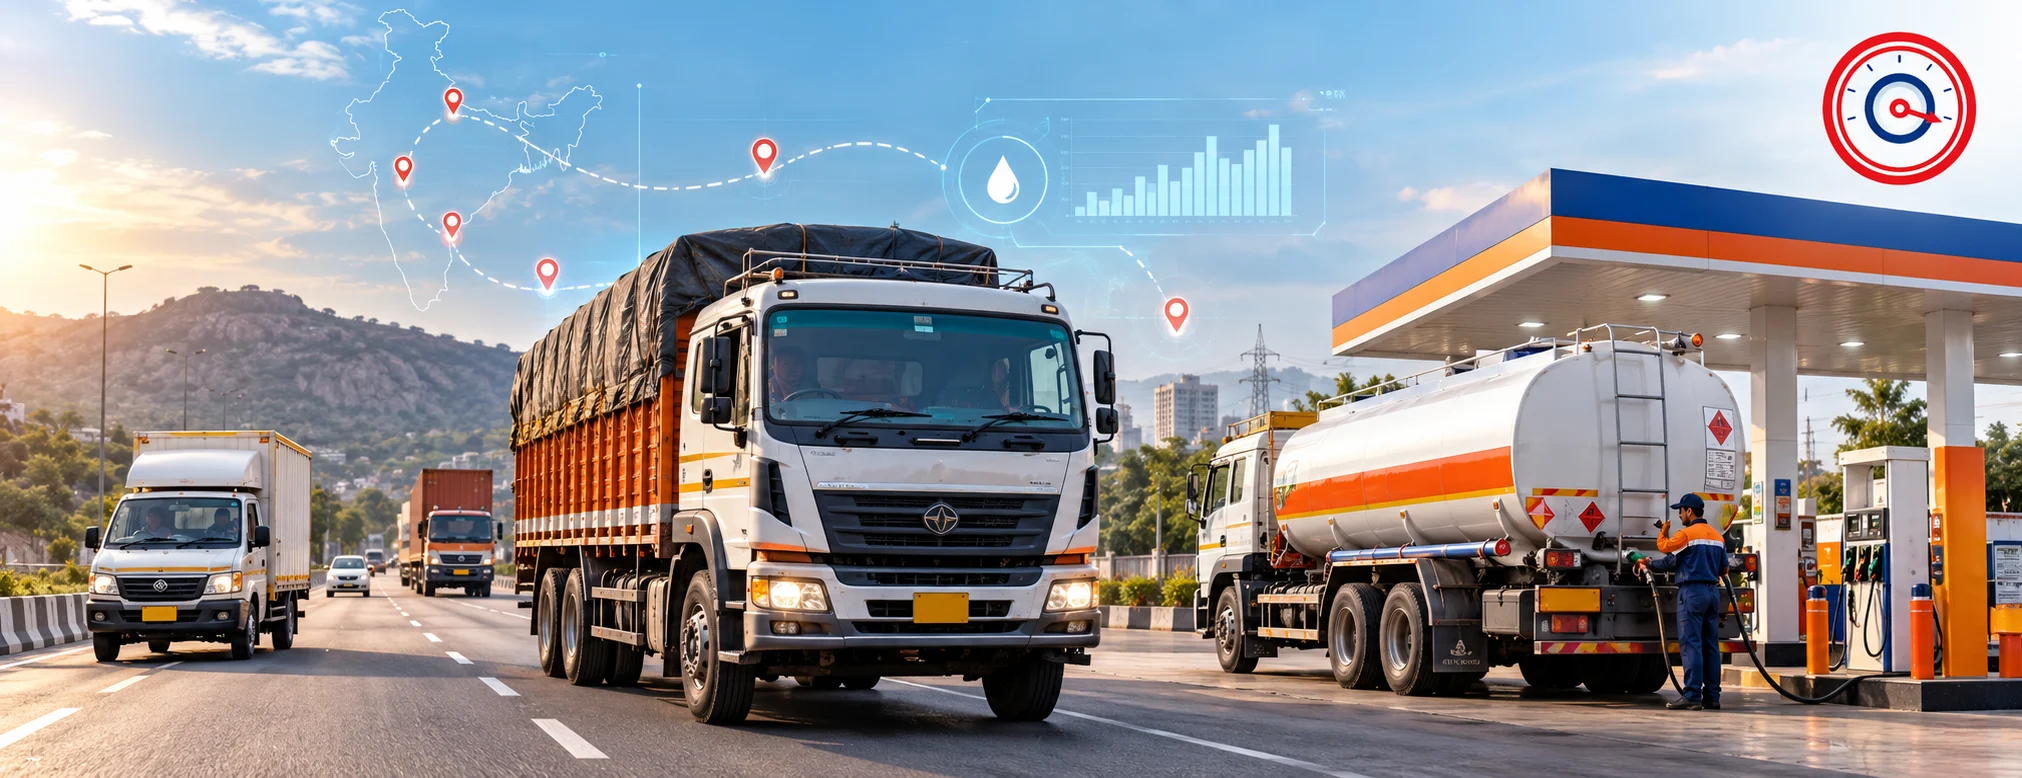
Petrol and Diesel Prices in India: 2021–2026 Trend
Looking at only one day’s pump price does not show the full fuel-cost picture.
A longer period helps fleet operators understand how significantly the operating environment can change.
The table below uses Delhi as a consistent reference market.
Petrol and Diesel Prices in Delhi: Selected Five-Year Price Snapshots
These figures are dated price snapshots, not annual averages. Petrol and diesel prices vary between cities and states because of differences in taxation and other local pricing factors.
| Period | Petrol | Diesel | What the Snapshot Shows |
|---|---|---|---|
| November 2021 | ₹110.04/L | ₹98.42/L | A high retail-price period before later excise-duty reductions |
| December 2023 | ₹96.72/L | ₹89.62/L | Prices remained relatively stable through much of this period |
| November 2024 | ₹94.77/L | ₹87.67/L | Prices were lower following tax and retail-price adjustments |
| December 2025 | ₹94.77/L | ₹87.67/L | Delhi prices remained at the 2024 level |
| 2026 | ₹102.12/L | ₹95.20/L | Prices moved materially above the end-2025 level |
Historical fuel-price information and price components are published by the Petroleum Planning & Analysis Cell and the Press Information Bureau.
The most useful lesson for fleet planning is not simply that fuel prices rise or fall.
It is that fuel-price exposure changes over time.
A transport company that creates long-term operating budgets or customer contracts using one fixed diesel-price assumption can quickly find its cost structure changing when fuel markets move.
Why 2026 Became an Important Year for Fuel Costs
One of the most significant developments in 2026 came from international crude markets.
In March, the Ministry of Petroleum & Natural Gas reported that crude prices had increased from approximately $70 per barrel to around $122 per barrel in less than four weeks.
The Government of India subsequently announced a ₹10-per-litre reduction in excise duty on petrol and diesel.
However, that did not automatically translate into an immediate ₹10 reduction at the pump.
The government explained that the duty reduction was intended partly to offset the impact of sharply higher international costs being absorbed by public-sector oil marketing companies.
This illustrates an important feature of India’s fuel market:
International crude prices and domestic petrol or diesel prices do not always move one-for-one.
Retail fuel pricing contains several different components.
Official policy information is available through the Press Information Bureau and the Ministry of Petroleum & Natural Gas.
Why Petrol and Diesel Prices Change in India
Understanding fuel pricing helps fleet businesses separate market factors from operational factors.
International Crude-Oil Prices
India imports a significant proportion of the crude oil it consumes.
When international crude becomes more expensive, refiners and oil marketing companies face higher input costs.
Global events such as:
- Supply disruptions
- Production changes
- Shipping interruptions
- Geopolitical conflict
- Changes in global demand
can therefore affect India’s fuel-cost environment.
International Petrol and Diesel Prices
Crude oil is not the only international benchmark that matters.
Petrol and diesel are also traded as refined products in global markets.
This means refined-product supply and demand can create additional pricing pressure even when crude prices themselves do not move by exactly the same amount.
The Petroleum Planning & Analysis Cell publishes international petroleum-price information for reference.
Rupee-Dollar Exchange Rate
International petroleum trade is largely dollar-linked.
If the Indian rupee weakens against the US dollar, the same barrel of imported crude can become more expensive in rupee terms even if its dollar price remains unchanged.
This means fleet businesses can be indirectly affected by both:
oil-market movements
and
currency movements.
Central Excise Duty
Central duties form part of India’s fuel-price structure.
Government policy can therefore influence how much international cost pressure reaches the final consumer.
Over the past five years, India has seen multiple changes to fuel duties and retail prices.
According to government releases, central excise duties on petrol and diesel were reduced substantially through measures taken in late 2021 and 2022, while oil marketing companies later reduced petrol and diesel retail prices by ₹2 per litre in March 2024.
State VAT and Local Taxes
There is no single petrol or diesel retail price for all of India.
State tax structures differ.
This is one reason petrol or diesel can cost noticeably more in one city than another even on the same day.
PPAC publishes state-wise fuel tax information through its VAT, Sales Tax and GST rates section.
For fleets operating across several states, this difference can affect refuelling strategy and overall fuel spend.
Dealer Commission and Distribution Costs
Retail fuel pricing can also include:
- Dealer commission
- Freight
- Distribution expenses
- Marketing margins
- Other supply-chain costs
PPAC publishes information on dealer and distributor commissions.
The final pump price therefore reflects considerably more than the cost of crude oil alone.
Where Does CNG Fit Into the Picture?
CNG has become an important fuel for many urban and regional vehicle operations.
It is commonly used in:
- Taxis
- Buses
- Light commercial vehicles
- Last-mile delivery fleets
- Urban service fleets
- Selected regional transport operations
However, CNG also does not have one national retail price.
Prices vary between city-gas distribution areas.
For example, Indraprastha Gas Limited publishes CNG prices for Delhi and surrounding markets, while Mahanagar Gas Limited publishes rates for its operating areas in and around Mumbai.
This means a fleet should not compare:
Diesel ₹ per litre
directly against:
CNG ₹ per kilogram
and assume the lower number represents the cheaper operating option.
Petrol vs Diesel vs CNG: Compare Cost Per Kilometre
A better fleet-level comparison is:
Fuel Cost per Kilometre = Fuel Consumed ÷ Distance Travelled × Fuel Price
Consider two vehicles travelling the same 100 km.
One may use diesel.
Another may use CNG.
The displayed fuel price alone does not tell the fleet which vehicle costs less to operate.
Fleet managers should also consider:
- Actual fuel efficiency
- Vehicle payload
- Purchase price
- Route type
- Maintenance cost
- Refuelling availability
- Operating range
- Refuelling time
- Vehicle downtime
- Residual value
A city delivery vehicle operating predictable urban routes has very different requirements from a long-haul tractor, mining tipper or construction vehicle.
There is therefore no universal answer to:
Which is better: petrol, diesel or CNG?
The more useful question is:
Which fuel and vehicle combination produces the most reliable operating cost for this specific duty cycle?
Why Diesel Prices Matter So Much to Commercial Fleets
Diesel remains central to many heavy commercial operations in India.
It is widely used across:
- Long-haul trucking
- Construction fleets
- Mining vehicles
- Tankers
- Industrial vehicles
- Heavy equipment
- Regional freight operations
For these businesses, fuel is not an occasional expense.
It is a major recurring variable cost.
Consider a simple illustration.
A fleet consumes:
5,000 litres of diesel per day
At ₹88 per litre:
Daily fuel cost = ₹4,40,000
At ₹95 per litre:
Daily fuel cost = ₹4,75,000
Difference:
₹35,000 per day
This example is illustrative rather than a benchmark for every fleet.
Its purpose is to demonstrate the scale effect.
A relatively small change in the cost of each litre can become significant when multiplied across hundreds of vehicles and thousands of kilometres.
The Most Important Question: What Can a Fleet Actually Control?
Fleet operators cannot directly control:
- Global crude-oil prices
- International conflicts
- Currency markets
- Central fuel taxation
- State VAT
- International product prices
They can influence:
- Fuel consumed
- Idle time
- Route efficiency
- Unnecessary kilometres
- Refuelling activity
- Driver behaviour
- Vehicle maintenance
- Fleet allocation
- Abnormal fuel events
That changes the management question from:
How do we make diesel cheaper?
to:
How do we avoid wasting expensive diesel?
This second question can actually be addressed through operational improvement.
Measure Fuel Consumption at Vehicle Level
A monthly fuel bill tells a business how much money it spent.
It does not necessarily explain why.
Two vehicles can travel similar distances while consuming noticeably different amounts of fuel.
Possible reasons include:
- Different loads
- Traffic conditions
- Route difficulty
- Engine hours
- Idle time
- Driver behaviour
- Vehicle condition
- Fuel-level events
A Fuel Management System can help connect fuel activity with individual vehicles and operating data.
Depending on the installed hardware and configuration, managers may review:
- Vehicle-wise fuel activity
- Refuelling events
- Fuel-level trends
- Distance travelled
- Vehicle movement
- Idle periods
- Historical patterns
Instead of asking:
Why is our total fuel bill high?
the fleet can begin asking:
Which vehicles are consuming more than comparable vehicles, and what operating condition explains the difference?
That is a much more useful question.
Use Fuel-Level Data to Investigate Abnormal Changes
Some operations require more detailed visibility into vehicle fuel tanks.
A compatible Fuel Level Sensor can help maintain a history of recorded changes in fuel level.
That data can support investigation of:
- Refuelling events
- Significant fuel drops
- Unusual fuel patterns
- Differences between fuel records and vehicle activity
However, a recorded fuel drop should not automatically be labelled as theft.
Possible causes can include:
- Normal consumption
- Leakage
- Fuel draining
- Sensor behaviour
- Calibration issues
- Installation problems
A stronger process is:
Detect → Verify → Investigate → Act
The objective is better visibility, not automatic conclusions.
Reduce Avoidable Idling
A commercial vehicle can continue consuming fuel while producing no useful distance.
However, not every stationary engine-on period is unnecessary.
Some vehicles may require the engine to operate while stationary because of:
- PTO equipment
- Hydraulic systems
- Refrigeration
- Loading operations
- Specialized equipment
The correct objective is therefore not:
Zero idling
It is:
Reduce avoidable idling.
As each litre becomes more expensive, repeated unnecessary engine-on time becomes more costly.
Diselmap’s guide to fleet idle time and fuel waste explains this area in more detail.
Use GPS Data to Reduce Unnecessary Kilometres
Fuel efficiency is not only about what happens inside the engine.
It is also about how the vehicle moves.
A GPS Tracking System can help fleet managers review:
- Actual route movement
- Vehicle location
- Trip history
- Stops
- Route deviations
- Repeated depot visits
- Unnecessary empty movement
For example, a business may discover that vehicles are repeatedly travelling additional kilometres because of:
- Poor job allocation
- Avoidable detours
- Unnecessary depot returns
- Inefficient dispatching
- Inconsistent route execution
The goal does not have to be the mathematically shortest route every time.
The goal is to reduce distance that creates little or no operational value.
Use Telematics to Add Context
GPS tells the fleet where a vehicle travelled.
It does not always explain what was happening while the vehicle was there.
Telematics Solutions can combine GPS information with additional operational data.
Depending on vehicle and hardware compatibility, that may include:
- Ignition status
- Engine activity
- Engine hours
- Idle time
- Selected driver events
- Vehicle data
- Sensor inputs
This context can help managers understand why one vehicle consumes more fuel than another rather than simply identifying that a difference exists.
Driver Behaviour Also Matters
Driving style can influence fuel consumption.
Useful signals may include:
- Excessive speed
- Harsh acceleration
- Repeated heavy braking
- Long idle periods
- Inconsistent driving patterns
Driver Behaviour Monitoring can help managers identify patterns that may require investigation or coaching.
However, driver data should always be interpreted in context.
A driver operating:
- A heavily loaded truck
- A construction vehicle
- A congested city route
- A mountain route
should not automatically be compared with a lightly loaded vehicle operating on an open highway.
The objective should be improvement rather than simply penalizing events.
Maintenance Can Become a Fuel-Cost Issue
Poor maintenance is normally associated with:
- Breakdowns
- Repair costs
- Downtime
But it can also affect operating efficiency.
When investigating unusually high vehicle consumption, fleet managers should consider factors such as:
- Tyre pressure
- Tyre condition
- Wheel alignment
- Air filters
- Engine condition
- Fault codes
- Preventive service intervals
This does not mean every maintenance activity creates a guaranteed fuel saving.
Different vehicles and operating conditions behave differently.
Maintenance should instead be treated as one potential cause when a vehicle consistently performs differently from comparable assets.
Track Fuel Cost Per Kilometre
Total fuel spend alone can be misleading.
A fleet may spend more fuel simply because it completed more work.
A useful operating measure is:
Fuel Cost per Kilometre = Total Fuel Cost ÷ Distance Travelled
This can be compared by:
- Vehicle
- Vehicle type
- Route
- Depot
- Month
- Operating period
For example:
Truck A = ₹24/km
Truck B = ₹27/km
That difference does not automatically prove Truck B is inefficient.
Management should investigate:
- Load
- Route
- Traffic
- Idle time
- Vehicle condition
- Driving behaviour
- Engine hours
before deciding what caused the difference.
For a broader operating-cost approach, see Diselmap’s fleet cost per kilometre guide.
A Practical Fuel-Cost Control Framework for Fleets
When petrol, diesel or CNG costs remain high, simply instructing drivers to “use less fuel” is rarely enough.
A structured process works better.
1. Establish a Baseline
Measure:
- Fuel consumed
- Fuel expenditure
- Kilometres travelled
- Engine hours
- Idle time
- Fuel cost per kilometre
2. Compare Similar Vehicles
Do not compare unrelated assets.
Benchmark vehicles performing similar work in similar conditions.
3. Identify Outliers
Look for vehicles, routes or operating periods with consistently higher consumption.
4. Investigate the Cause
Review:
- Routes
- Idling
- Driver events
- Fuel activity
- Load
- Vehicle condition
- Operating environment
5. Correct the Operational Cause
Focus on repeated problems rather than reacting to one unusual trip.
6. Measure Again
Compare the same KPI after making an operational change.
7. Keep Monitoring
Fuel efficiency should be treated as an ongoing trend rather than a one-time exercise.
Why Data Quality Matters More When Fuel Is Expensive
Better decisions require reliable data.
Fleet managers should verify whether:
- Odometer readings are accurate
- GPS distance is reliable
- Vehicles are assigned correctly
- Refuelling records match the correct asset
- Fuel sensors are properly calibrated
- Engine-hour information is available
- Abnormal events are being reviewed consistently
When fuel becomes more expensive, poor measurement also becomes more expensive.
Do not react to a fuel anomaly before checking whether the data behind it is trustworthy.
Fuel Price vs Fuel Waste: Don’t Confuse the Two
A higher monthly fuel bill does not automatically mean that fleet efficiency has become worse.
The increase may be caused by:
- Higher fuel prices
- More kilometres travelled
- Increased productive work
- A different vehicle mix
- Higher loads
- Genuine inefficiency
Fleet managers should therefore separate:
Price Effect
What each litre or kilogram costs.
Consumption Effect
How much fuel the operation uses.
This distinction matters.
Fuel-management technology cannot control the price effect.
Its value is in helping management understand the consumption effect.
What High Fuel Costs Mean for Fleet Budgeting
Fuel-price volatility should also influence fleet budgeting.
Instead of using one fixed diesel price for an entire year, businesses can model different scenarios.
For example:
Base fuel-price scenario
Normal expected operating budget.
Higher-price scenario
Estimated additional operating cost if fuel rises.
Efficiency-improvement scenario
Potential reduction in avoidable operating cost through better fleet management.
This does not predict future fuel prices.
It simply helps the business understand its exposure.
For contract transport operations, this type of modelling may also support discussions about:
- Customer pricing
- Fuel escalation clauses
- Route profitability
- Contract margins
Can Technology Completely Solve High Fuel Costs?
No.
GPS, telematics and fuel sensors cannot make international crude oil cheaper.
Technology cannot eliminate:
- Traffic congestion
- Difficult terrain
- Heavy payloads
- Necessary idling
- Every mechanical problem
- Every external delay
Its purpose is different.
It can help a fleet answer questions such as:
Where is fuel being consumed?
Which vehicles differ from the normal pattern?
Where does excessive idling occur?
Are vehicles travelling unnecessary kilometres?
Did refuelling occur as expected?
Did an operational change improve the result?
Better visibility supports better decisions.
It does not replace operational management.
Frequently Asked Questions
Why are petrol and diesel prices high in India?
Petrol and diesel prices are influenced by international crude and refined-product prices, exchange rates, central duties, state VAT, dealer commission, freight and domestic pricing conditions. Because state taxes differ, retail fuel prices can also vary between Indian cities.
How have petrol and diesel prices changed over the last five years?
Prices have moved through periods of decline, stability and renewed increases. Delhi petrol, for example, was ₹110.04 per litre in November 2021, moved below ₹95 by late 2024 and remained around that level at the end of 2025 before moving higher during 2026. These figures should be treated as selected dated snapshots rather than annual averages.
Why did international oil prices rise sharply in 2026?
The Government of India reported a sharp rise in international crude prices during March 2026 amid conflict in West Asia and disruption to global energy supplies. Crude moved from roughly $70 to about $122 per barrel over a period of less than four weeks.
Is CNG cheaper than diesel for fleet vehicles?
Not necessarily. Fleet operators should compare actual fuel cost per kilometre together with vehicle efficiency, payload, range, refuelling availability, maintenance costs, vehicle acquisition cost and duty cycle.
Does CNG have the same price everywhere in India?
No. CNG prices vary between city-gas distribution areas. Operators should use the applicable local supplier price when calculating vehicle operating costs.
How can commercial fleets reduce fuel costs?
Fleet managers can focus on vehicle-wise fuel consumption, avoidable idling, unnecessary kilometres, route efficiency, driver behaviour, refuelling activity, vehicle maintenance and fuel cost per kilometre.
Can GPS tracking reduce fuel consumption?
GPS tracking does not directly reduce fuel consumption. It provides route, location, stop and trip information that can help managers identify unnecessary movement or inefficient route patterns and then take corrective action.
Can fuel monitoring detect diesel theft?
Fuel-monitoring systems can identify unusual fuel-level changes that require investigation. An abnormal drop should not automatically be classified as theft because consumption, leakage, sensor behaviour or calibration problems may also cause unusual readings.
What is a useful KPI for measuring fleet fuel cost?
Fuel cost per kilometre is a useful starting KPI. It should be evaluated alongside litres consumed, engine hours, idle time, vehicle load, route conditions and other operating factors.
The Bigger Lesson for Fleet Operators
Fuel markets can change.
Currencies can change.
Taxes can change.
International energy conditions can change.
What a fleet business can control is how efficiently it uses the fuel it purchases.
That changes the management question from:
When will diesel become cheaper?
to:
Are we making the best possible use of every litre we buy?
The second question can be measured and acted upon.
Control What Your Fleet Can Control with Diselmap
Fuel prices may rise or fall, but fleet operators can still control how efficiently fuel is used.Diselmap brings together fuel monitoring, GPS tracking, telematics, vehicle activity and fleet data to help managers identify avoidable fuel waste, compare vehicle consumption, review idle time and analyse route efficiency.
With better operational visibility, fleet teams can move beyond fuel receipts and make more informed decisions based on actual vehicle performance.Fuel prices may remain outside your control. Fuel visibility does not have to be.
Measure → Understand → Reduce Waste → Verify the Result.