
- Our Article
How GPS and Fleet Data Can Reduce Delays in Road Transport Operations
A truck arriving late does not always mean the driver drove too slowly.The delay may have started before the vehicle even left the depot. A truck might wait for loading, depart later than planned, take an unexpected route, spend too long at a customer location, encounter congestion, remain stationary with the engine running, or lose operating time because of a vehicle issue.Without reliable vehicle data, these events can appear simply as:
“The truck was delayed.”
GPS and fleet data provide much more context.They help transport teams understand where the delay happened, how long it lasted, whether it keeps happening, and which part of the operation may require attention.The objective is not to eliminate every delay. Road transport will always be affected by traffic, weather, customer schedules, infrastructure and other conditions outside a fleet’s control.The real opportunity is to identify and reduce avoidable delays.
Quick Answer
GPS and fleet data can help reduce road transport delays by showing vehicle location, trip progress, stop duration, dwell time, route movement, idle time and recurring waiting locations.
When this information is reviewed together, fleet managers can identify whether delays are coming from dispatching, loading, routes, customer dwell time, vehicle downtime or other operational causes.
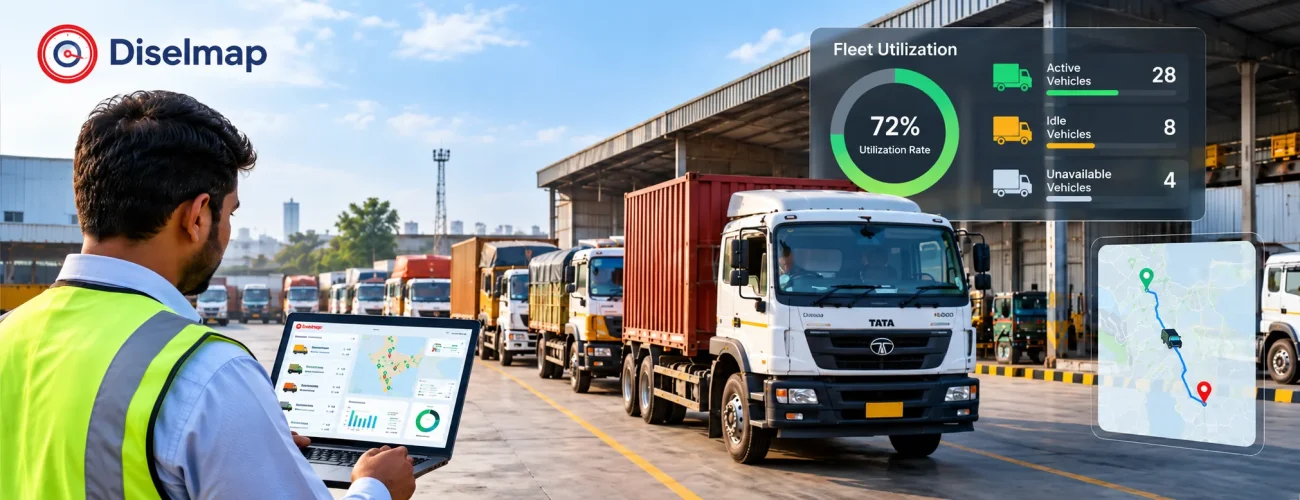
Why Knowing Vehicle Location Is Not Enough
Real-time vehicle location is valuable.
It answers:
Where is the vehicle now?
But managing transport delays requires answering additional questions:
- When did the vehicle actually leave the depot?
- Was departure later than scheduled?
- Has the vehicle remained stationary for an unusual amount of time?
- Did it follow the expected route?
- How long did it spend at the customer location?
- Was the engine running during a long stop?
- Is the same location delaying multiple vehicles?
- Is the vehicle unavailable because of a maintenance issue?
- Is the problem recurring across similar trips?
This is the difference between basic vehicle tracking and operational visibility.
A GPS Tracking System provides the location and movement layer. When this is combined with trip history, telematics and operational information, fleet teams gain more context for investigating delays.
Where Transport Delays Actually Begin
Many fleets focus on the road when investigating late deliveries.
But lost time can occur at several stages of a trip.
Before the Vehicle Leaves the Depot
A truck can fall behind schedule before travelling a single kilometre.
Possible causes include:
- Late vehicle allocation
- Loading delays
- Driver availability
- Documentation delays
- Vehicle inspection
- Dispatch changes
- Maintenance issues
- Waiting for trip instructions
Consider a truck scheduled to depart at 8:00 AM.
If GPS movement shows that it did not leave until 8:45 AM, the operation has already lost 45 minutes before traffic becomes relevant.
Tracking scheduled and actual departure times helps separate depot delay from road delay.
During Transit
Once the journey begins, delays may come from:
- Traffic congestion
- Road restrictions
- Diversions
- Unplanned stops
- Fuel stops
- Toll or checkpoint waiting
- Driver breaks
- Vehicle problems
GPS trip history can help reconstruct what happened instead of relying only on the final arrival time.
At Customer or Loading Locations
A truck may reach its destination on time and still lose significant operating time.
Long waits may occur at:
- Warehouses
- Factories
- Distribution centres
- Customer locations
- Construction sites
- Logistics hubs
- Loading yards
If the same location repeatedly holds vehicles for long periods, the issue may be an operational bottleneck rather than a transport problem.
Between Trips
A vehicle may finish one assignment and remain unused for a long period before receiving the next one.
This affects productivity and can also reduce fleet utilization.
The truck may be mechanically available but still not producing useful work.
How GPS Data Helps Identify Delays
GPS becomes more useful when fleet teams analyse what happens across the whole trip rather than watching only the live vehicle icon.
Real-Time Vehicle Location
Live location helps dispatch teams quickly determine whether a vehicle is:
- Still at the depot
- Moving on the expected route
- Stationary
- Near the delivery point
- Inside a customer site
- Operating in an unexpected area
This also reduces unnecessary calls to drivers just to ask for location updates.
Trip Start and Departure Time
One of the first questions in any delay investigation should be:
Did the vehicle leave on time?
GPS movement and ignition information can help establish actual departure.
Comparing planned and actual departure times can reveal recurring problems at:
- Dispatch desks
- Loading areas
- Vehicle staging zones
- Individual depots
Trip History
Trip history gives the fleet a timeline of what happened.
Depending on the system, it may include:
- Trip start
- Route travelled
- Stops
- Stop duration
- Distance
- Arrival
- Trip completion
This makes it much easier to investigate a delayed trip after the event.
Stop Duration
A stop itself is not necessarily a problem.
The duration and context matter.
A five-minute stop may be completely normal.
A vehicle stopping for 50 minutes at the same location during multiple trips deserves closer examination.
Useful questions include:
- Is the location expected?
- Is the stop necessary?
- Does every vehicle wait there?
- Does it happen at a particular time?
- Is the vehicle inside a customer or warehouse geofence?
Route Movement
GPS can also help fleet teams compare expected movement with actual vehicle movement.
Unusual activity may include:
- Route deviation
- Repeated diversions
- Unexpected stops
- Vehicle backtracking
- Movement outside expected operating areas
However, route deviation should always be interpreted in context.
A different route may be reasonable because of road closures, traffic, customer instructions or dispatch decisions.
The data should support investigation, not automatic blame.
How Geofencing Helps Measure Waiting Time
A geofence is a virtual boundary around a real location.
Fleet managers can create geofences around places such as:
- Depots
- Warehouses
- Customer sites
- Plants
- Fuel stations
- Construction sites
- Distribution centres
When a vehicle enters or leaves the area, the system can record the event.
This creates useful questions that can be answered with data:
When did the truck enter the warehouse?
How long was it inside?
When did it leave?
Imagine a truck enters Customer Site A at 10:15 AM and leaves at 11:20 AM.
Its customer dwell time was approximately 65 minutes.
If similar vehicles repeatedly show long dwell times at the same location, the fleet now has evidence of a recurring operational issue.
Fleet Data Explains What GPS Location Cannot
GPS tells you where the vehicle is.
Fleet and telematics information can help explain what the vehicle is doing.
A telematics device may provide additional operational information depending on the vehicle and integration.
Ignition Status
A vehicle parked with the ignition off may represent scheduled waiting or completed work.
A stationary vehicle with the engine running may represent a different operating condition.
Idle Time
A truck can be stationary while continuing to consume fuel and accumulate engine hours.
Reviewing fleet idle time alongside stop duration helps fleet managers understand whether a long stationary period also involved unnecessary engine operation.
Engine Hours
Engine-hour information can help distinguish actual engine activity from road distance.
It is particularly useful for specialized vehicles and equipment that may operate while stationary.
Vehicle Availability
Not every delay is caused during the trip.
Sometimes the assigned vehicle is not ready when required because of maintenance or another availability issue.
Combining transport data with preventive maintenance information helps fleet teams determine whether reliability problems are affecting schedules.
Driver and Vehicle Events
Depending on the system, selected driver or vehicle events may add useful context.
These events should be reviewed as part of the overall trip rather than automatically treated as the cause of a late arrival.
Turn a Late Delivery Into a Delay Timeline
A useful delay investigation should answer:
Where was the time actually lost?
Suppose a truck is scheduled to arrive at 2:00 PM but reaches the customer at 3:20 PM.
Looking only at the final time gives:
Total delay: 80 minutes
That does not explain what happened.
Fleet data may produce a clearer timeline:
| Event | Time Lost |
|---|---|
| Late depot departure | 30 minutes |
| Loading queue | 20 minutes |
| Unplanned roadside stop | 15 minutes |
| Traffic near destination | 15 minutes |
| Total | 80 minutes |
Now the operations team can see that the delay did not come from one problem.
Several smaller issues accumulated during the trip.
That matters because each issue requires a different response.
Traffic may be difficult to control.
Late dispatch, loading queues and unnecessary waiting may be much more actionable.
Delay Metrics Worth Tracking
Fleet teams do not need dozens of measurements.
A focused set of metrics is usually more useful.
Departure Variance
Compare the scheduled departure time with the actual departure time.
Departure Variance = Actual Departure Time – Planned Departure Time
If departure variance repeatedly increases at the same depot, investigate the dispatch or loading process.
Arrival Variance
Compare actual arrival with planned arrival.
Arrival Variance = Actual Arrival Time – Planned Arrival Time
Review this across many trips rather than judging performance from one delivery.
Dwell Time
Dwell time measures how long a vehicle remains at a location before continuing its operation.
It is especially useful at:
- Customer locations
- Warehouses
- Plants
- Loading areas
- Distribution centres
Unplanned Stop Time
Measure significant stops that occur outside the expected operating plan.
Not every unexpected stop is avoidable.
The objective is to identify recurring patterns.
Trip Duration
Compare travel times for similar routes and operating conditions.
Large differences may indicate:
- Scheduling problems
- Regular congestion
- Excessive stopping
- Route inefficiency
- Loading or unloading problems
Idle Time
Idle time helps distinguish stationary engine activity from actual movement.
It should be reviewed alongside stop location and operational purpose.
Vehicle Availability
If a truck is repeatedly unavailable when dispatch needs it, the delay problem may actually be connected to fleet maintenance or asset allocation.
Look for Patterns Instead of Blaming One Trip
One late delivery may be an exception.
Repeated delays usually reveal more.
A strong fleet analysis looks for patterns across multiple trips.
Analyse by Route
Ask:
- Which routes consistently take longer?
- Where do vehicles regularly stop?
- At what points does travel time become unpredictable?
Analyse by Customer
Some customers may consistently require longer waiting or unloading periods.
Instead of assuming the road is causing the problem, compare dwell time between customer locations.
Analyse by Depot
One depot may have much higher departure variance than another.
That can indicate a local loading, documentation or dispatch issue.
Analyse by Time
Certain delays may occur mainly:
- During morning dispatch
- During peak traffic
- Near shift changes
- During particular customer receiving windows
Analyse by Vehicle
A particular vehicle may experience repeated availability or maintenance problems.
Analyse by Driver
Driver data can be useful, but it should be evaluated alongside route, customer, vehicle and schedule conditions.
The objective is root-cause identification, not simply finding someone to blame.
How Better Fleet Data Supports Dispatch Decisions
Dispatching becomes difficult when teams do not have a clear view of current fleet activity.
A dispatcher may need to know:
- Which vehicles are available
- Where each vehicle is located
- Which vehicles are currently assigned
- Which trips are delayed
- How much work remains
- Whether another suitable vehicle is closer
- Whether a vehicle has maintenance restrictions
A connected Fleet Management System can help bring relevant vehicle and trip information into one operational view.
Better visibility can support decisions such as:
- Reassigning a nearby available vehicle
- Adjusting the sequence of deliveries
- Informing customers earlier
- Avoiding repeated dispatch to congested locations
- Scheduling around known dwell-time patterns
The value comes from making operational decisions using current data rather than assumptions.
Reducing Avoidable Delays Step by Step
Data alone does not reduce delays.
The fleet has to act on what the data shows.
1. Establish a Baseline
Start by measuring current operations.
Track:
- Planned departure
- Actual departure
- Trip duration
- Stops
- Dwell time
- Idle time
- Arrival time
Use the same definitions consistently.
2. Classify Significant Delays
Use simple categories such as:
- Depot delay
- Loading delay
- Traffic or road delay
- Customer dwell
- Unplanned stop
- Route issue
- Vehicle downtime
- Documentation delay
- Other external cause
Avoid creating so many categories that the process becomes difficult to maintain.
3. Find the Largest Recurring Problems
Do not try to solve everything at once.
Identify:
- The location generating the most waiting
- The route with the highest repeated delay
- The depot with the largest departure variance
- Vehicles with recurring availability problems
Prioritize the issues that create the greatest operational impact.
4. Improve Dispatching
Use location and vehicle status to choose suitable vehicles more intelligently.
For example, assigning a nearby available truck may be more efficient than sending a distant vehicle simply because it was originally planned.
5. Address Loading and Customer Dwell
If the data shows that trucks regularly wait 45 minutes at the same loading point, routing software alone will not solve the problem.
Fleet teams may need to coordinate with:
- Warehouse teams
- Customer operations
- Loading staff
- Site supervisors
- Dispatch teams
Fleet data identifies the bottleneck. Operational changes reduce it.
6. Reduce Preventable Downtime
Review vehicles that regularly disrupt planned dispatch because they are unavailable.
Look at:
- Maintenance history
- Service schedules
- Recurring faults
- Mileage
- Engine hours
The goal is to improve vehicle readiness without delaying necessary maintenance.
7. Measure Again
After operational changes are introduced, review the same delay metrics.
Without a before-and-after comparison, it is difficult to determine whether the change worked.
Example: When the Route Is Not the Real Problem
Imagine a fleet experiences repeated late deliveries on one distribution route.
The first assumption is:
Traffic is causing the delay.
The fleet reviews several weeks of GPS and trip history.
The data shows:
- Vehicles regularly leave the depot 30 minutes late
- Highway travel time is relatively stable
- Trucks wait another 25-35 minutes at the same warehouse
- Traffic contributes only a small portion of the overall delay
A route change would therefore solve very little.
The bigger opportunities are:
- Improve departure preparation
- Adjust loading schedules
- Coordinate warehouse arrival windows
- Reduce queueing before loading
This illustrates an important principle:
Do not optimize the route until you understand where the delay actually occurs.
How Operational Visibility Changes Delay Management
A live vehicle map is useful.
Connected fleet information is more powerful because it gives location additional context.
Better real-time fleet visibility can combine information such as:
- Vehicle location
- Trip activity
- Stops
- Geofence events
- Engine status
- Idle activity
- Vehicle availability
- Historical movement
Compare these two alerts:
Vehicle stationary for 50 minutes
versus:
Vehicle entered Warehouse B at 11:10 AM and has remained inside the loading geofence for 50 minutes.
The second gives the operations team much more useful information.
It identifies both duration and operational context.
Different Transport Operations Need Different Delay Measures
A single dashboard should not be applied blindly to every fleet.
Long-Haul Transport
Useful measures may include:
- Departure variance
- Transit time
- Route stops
- Delivery arrival
- Customer dwell
Distribution Fleets
Useful measures may include:
- Stops per route
- Time per delivery
- Depot turnaround
- Route completion
- Time between assignments
Construction Transport
Tippers and construction vehicles may need measurements such as:
- Site entry and exit
- Loading queue
- Unloading time
- Idle time
- Engine hours
- Cycle time
Tanker and Specialized Fleets
Operational procedures may place greater importance on:
- Authorized routes
- Controlled stops
- Trip timing
- Vehicle status
- Site entry and exit
The measurements should match how the vehicle actually works.
What GPS and Fleet Data Cannot Solve
Technology should not be presented as a solution to every delay.
Fleet operators still face external factors such as:
- Severe congestion
- Road closures
- Accidents
- Weather
- Infrastructure restrictions
- Customer disruptions
- Regulatory restrictions
GPS does not remove these conditions.
Fleet data can instead help teams:
- Detect their effect earlier
- Understand the impact
- Communicate more accurately
- Adjust dispatch where practical
- Identify whether the issue is recurring
NITI Aayog’s work on improving freight efficiency in India has also highlighted the role of digitisation and better information in improving freight movement and logistics decision-making.
For additional industry context, see NITI Aayog’s freight and logistics research.
Common Mistakes When Using Fleet Data to Reduce Delays
Treating Every Stop as Unnecessary
Some stops are operationally required.
Review the location and purpose before classifying the event.
Assuming Every Delay Is a Driver Issue
If multiple drivers experience the same long wait at one warehouse, the underlying problem is unlikely to be an individual driver.
Watching Only the Live Map
Live tracking is useful for immediate decisions.
Historical trip data is usually more valuable for identifying recurring bottlenecks.
Creating Too Many Alerts
An operations team receiving constant notifications may begin ignoring them.
Alerts should focus on events that require meaningful action.
Tracking Data Without Clear Definitions
If one team considers a 10-minute stop a delay while another uses 30 minutes, reporting becomes inconsistent.
Set clear operational definitions.
Collecting Data Without Acting on It
A dashboard showing the same loading delay every week provides little value if no process change follows.
Measurement should lead to investigation and action.
A Practical 30-Day Delay Reduction Plan
A fleet does not need to redesign its entire operation at once.
A structured 30-day review can reveal useful opportunities.
Week 1: Establish the Baseline
Measure:
- Departure variance
- Trip time
- Significant stops
- Dwell time
- Idle time
- Arrival variance
Do not make major changes yet.
Understand current performance first.
Week 2: Identify Recurring Patterns
Group significant delays by:
- Depot
- Route
- Location
- Customer
- Vehicle
- Time
- Cause
Identify the largest repeatable problems.
Week 3: Address the Root Cause
Examples:
Late depot departure → review dispatch and loading sequence.
High warehouse dwell → coordinate loading slots.
Repeated vehicle downtime → review maintenance planning.
Unnecessary waiting → investigate assignment and scheduling.
Poor vehicle allocation → improve dispatch visibility.
Week 4: Compare Results
Review the same measurements again.
Ask:
- Are vehicles leaving closer to schedule?
- Has dwell time changed?
- Are recurring stops decreasing?
- Is trip consistency improving?
- Are fewer vehicles affected by the same bottleneck?
The goal is measurable operational improvement, not simply more fleet data.
Frequently Asked Questions
How does GPS help reduce road transport delays?
GPS helps fleet managers monitor vehicle location, trip progress, routes, stops and movement history. This can make it easier to identify where time is being lost during transport operations.
Can GPS identify the exact reason a truck is delayed?
Not always. GPS primarily shows location and movement. Combining it with trip records, geofences, ignition status, idle data, vehicle information and operational context provides a clearer explanation.
What is dwell time in transport operations?
Dwell time is the period a vehicle remains at an operational location such as a warehouse, customer site, plant, depot or loading point before continuing its journey.
How can geofencing help manage delays?
Geofencing can record vehicle entry and exit at defined locations, allowing fleet teams to measure how long vehicles spend at depots, warehouses, customer sites and other important locations.
What fleet data should be monitored for transport delays?
Useful information may include departure time, arrival time, GPS location, trip history, stops, dwell time, idle time, route movement, vehicle availability and selected telematics data.
Can telematics prevent delivery delays?
Telematics cannot prevent every delay. It can help identify recurring problems and provide the information needed to improve dispatching, scheduling, maintenance and operational processes.
How can fleet managers identify recurring bottlenecks?
Review multiple trips and group delay events by route, customer, depot, location, vehicle and time. Repeat patterns usually provide more useful information than individual incidents.
Does reducing transport delays also improve fleet utilization?
It can. Reducing unnecessary waiting and improving vehicle turnaround can allow available vehicles to spend more time performing productive work. Utilization should still be measured separately using an appropriate methodology.
Conclusion
Reducing road transport delays starts with understanding where time is actually being lost.GPS provides visibility into vehicle movement.
Fleet and telematics data add context around stops, dwell time, engine activity, vehicle availability and trip history.
Together, this information allows fleet teams to move beyond:
“The truck was late.”
and toward questions such as:
Where did the delay begin?
How much time was lost?
Is the same problem happening repeatedly?
Can the fleet do something about it?
A practical process is:
Measure → Classify → Compare → Find the Root Cause → Act → Verify
Not every delay can be eliminated.
But avoidable waiting, inefficient dispatching, recurring dwell time and preventable vehicle availability problems can be identified much more clearly when operational decisions are supported by reliable fleet data.
Improve Road Transport Visibility with Diselmap
Transport delays are easier to investigate when fleet teams can see more than a vehicle’s current location.
Diselmap helps businesses connect GPS tracking, telematics, trip history, vehicle activity and fleet information to create clearer visibility across road transport operations.
Use connected fleet data to understand vehicle movement, investigate recurring stops, measure waiting time and support more informed dispatch decisions.