
- Our Article
Fleet Utilization Rate : How to Calculate and Improve Vehicle Utilization
Owning more vehicles does not necessarily mean a fleet has more usable capacity.A business may have 50 trucks on its asset register, but if several vehicles spend much of the week waiting at a depot, undergoing repeated repairs, sitting without assignments or operating far below their expected workload, the fleet may not be using its assets efficiently.This is where fleet utilization rate becomes useful.Fleet utilization rate helps fleet managers understand how much of their available vehicle capacity is actually being used for productive work.
Unlike a simple vehicle count, utilization looks at activity. It can reveal underused vehicles, uneven workload distribution, operational delays and opportunities to make better decisions about deployment, maintenance and fleet size.However, measuring utilization correctly requires more than looking at whether a vehicle moved during the day.The fleet first needs to define what counts as productive use, when a vehicle is considered available, and which measurement method matches the operation.
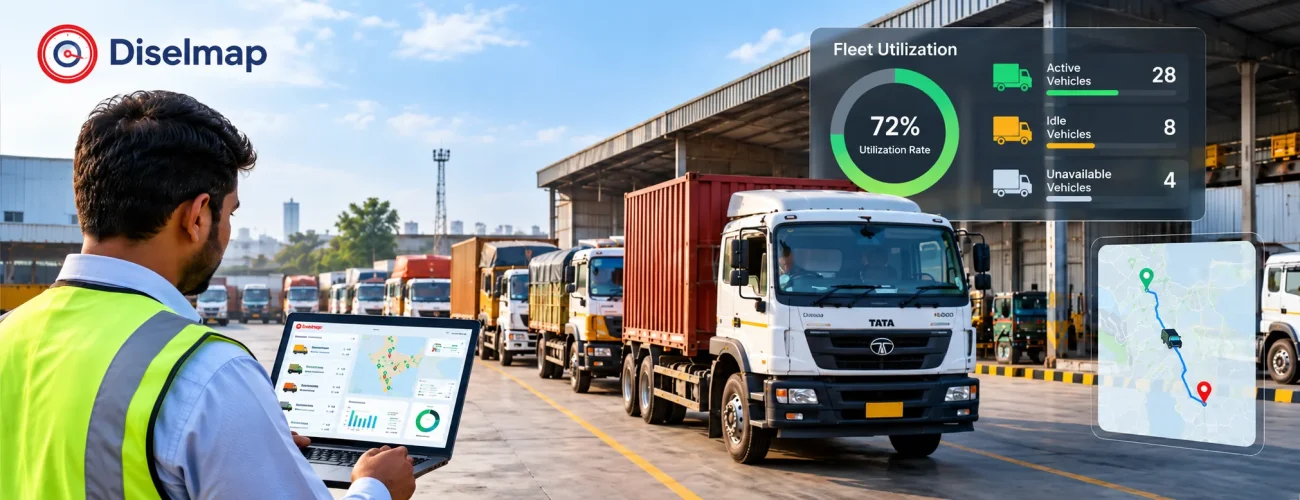
What Is Fleet Utilization Rate?
Fleet utilization rate measures how much of the vehicle capacity available to an operation is actually being used for productive activity during a defined period.
In simple terms, it answers:
Of the vehicle capacity we had available, how much did we actually use?
For a logistics fleet, productive use may include completed trips and scheduled transport operations.
For a service fleet, a vehicle parked at a customer site may still be productively assigned even though it is not moving.
For construction equipment, productive utilization may be better represented by operating or engine hours than distance travelled.
This is why a good utilization measurement should reflect how the asset creates value for the business, rather than relying on movement alone.
Why Fleet Utilization Matters
Commercial vehicles and equipment create costs whether they are used efficiently or not.
Depending on the operation, these may include:
- Acquisition or lease costs
- Insurance
- Registration
- Maintenance
- Parking
- Administration
- Depreciation
- Financing
- Telematics and other supporting systems
When an asset remains consistently underused, these costs are spread across less productive work.
At the same time, very high utilization without sufficient maintenance capacity or operational reserve can create a different problem.
The objective is therefore not simply to maximize every vehicle’s percentage.
The objective is to maintain appropriate utilization for the role of each asset while preserving maintenance, reliability and operational flexibility.
For a broader view of related performance indicators, see fleet management KPIs.
How to Calculate Fleet Utilization Rate
There is no single measurement method that works equally well for every fleet.
The most useful method depends on whether your operation is driven primarily by time, distance, trips, deployment or equipment operating hours.
For many fleets, time-based utilization is the clearest starting point.
Time-Based Fleet Utilization Formula
Use:
Fleet Utilization Rate (%) = Productive Hours ÷ Available Hours × 100
Suppose a truck was available for dispatch for 200 hours during a month.
During that period, it performed 142 hours of productive work.
The calculation is:
142 ÷ 200 × 100 = 71%
The vehicle’s utilization rate for that period is therefore 71%.
The calculation itself is simple.
The difficult part is defining the two inputs correctly.
What Counts as Available Time?
Available time should represent the period during which the vehicle was reasonably expected to be available for operational use.
It should normally follow your actual operating schedule.
For example, if a delivery fleet operates one 10-hour shift each weekday, calculating utilization against 24 hours per day would make the result misleading.
A practical availability rule might consider:
- Scheduled operating hours
- Normal working days
- Planned shifts
- Vehicle role
- Planned maintenance policy
- Operational reserve requirements
Most importantly, apply the same definition consistently.
Do not calculate availability one way for one vehicle and differently for another vehicle in the same comparison group.
What Counts as Productive Vehicle Use?
This requires even more care.
Productive use does not always mean movement.
Consider three vehicles:
Long-Haul Truck
Useful activity may be measured using:
- Driving time
- Assigned trip time
- Loaded movement
- Completed transport work
Field Service Vehicle
The vehicle may be parked for two hours while the technician performs work at a customer location.
GPS shows no movement, but the asset is still supporting productive activity.
Excavator
An excavator may work inside a small area for an entire shift.
Distance travelled would provide a poor measure of its utilization.
Operating hours or supported equipment activity may be more meaningful.
This is why utilization should be based on the business role of the asset, not one generic rule for every vehicle.
Other Ways to Measure Vehicle Utilization
Time-based utilization is useful, but it is not the only option.
Distance-Based Utilization
Road fleets may compare actual kilometres travelled with an expected operating range.
A simple structure is:
Distance Utilization (%) = Actual Productive Distance ÷ Planned or Available Distance Capacity × 100
This can be useful for:
- Line-haul transport
- Distribution fleets
- Fixed-route operations
- Vehicles with predictable daily mileage
However, kilometres alone do not show whether those kilometres were productive.
A truck travelling empty may record high mileage while still having an operational efficiency problem.
Vehicle Deployment Rate
Some fleets need a simpler fleet-level view.
Use:
Vehicle Deployment Rate (%) = Vehicles Deployed ÷ Vehicles Available × 100
For example, if 36 of 45 service-ready vehicles were deployed during a shift:
36 ÷ 45 × 100 = 80%
This can quickly show how much of the available fleet is being put into operation.
It should not replace deeper vehicle-level analysis because a vehicle counted as “deployed” may still have been used for only part of the shift.
Engine-Hour-Based Utilization
For construction, mining and other equipment-intensive fleets, engine or operating hours may be more relevant than distance.
Telematics and compatible equipment data can help measure:
- Engine-on hours
- Operating periods
- Idle time
- Asset movement
- Site activity
This is especially useful where vehicles or machines perform substantial work without travelling long distances.
Calculate Utilization at Both Vehicle and Fleet Level
Fleet averages can hide significant differences between individual vehicles.
Imagine ten similar trucks.
The overall fleet utilization may appear acceptable, but closer inspection could show:
- Three trucks operating heavily
- Four trucks operating normally
- Three trucks receiving very little work
The fleet-level number alone would not reveal this imbalance.
For better analysis, calculate utilization:
By Vehicle
Identify individual assets that consistently receive too little or too much work.
By Vehicle Type
Compare trucks with similar trucks, buses with buses, and construction equipment with similar equipment.
By Depot or Branch
Different locations may have very different demand patterns.
By Week or Month
Trends are usually more useful than one isolated day’s result.
By Operational Role
A backup vehicle should not be judged against the same utilization target as a primary delivery vehicle.
Avoid Averaging Percentages Incorrectly
One common mistake is calculating utilization for every vehicle and then taking a simple average.
That can produce misleading results if different vehicles have different available hours.
For fleet-wide utilization, a better calculation is generally:
Total Productive Hours Across Fleet ÷ Total Available Hours Across Fleet × 100
This gives heavier weight to vehicles with greater available operating capacity.
Keep vehicle-level percentages for diagnosis, but use fleet-level totals when measuring overall utilization.
Fleet Utilization Is Not the Same as Vehicle Availability
These two measurements are related, but they answer different questions.
Availability asks whether the vehicle was ready to work.
Utilization asks whether the available vehicle was actually used.
A vehicle can therefore be:
Available but underused.
For example, a truck may be mechanically ready for an entire week but receive only two assignments.
Conversely, poor availability can limit utilization because vehicles cannot perform productive work while unavailable for service.
For that reason, fleet managers should review utilization alongside maintenance and downtime information rather than treating it as an isolated percentage.
There Is No Universal “Good” Fleet Utilization Rate
A target that works for one fleet may be inappropriate for another.
Utilization depends on factors such as:
- Fleet type
- Vehicle role
- Number of shifts
- Seasonal demand
- Customer requirements
- Maintenance strategy
- Emergency capacity
- Geographic coverage
- Vehicle specialization
A dedicated long-haul truck and an emergency backup vehicle should not be expected to have the same utilization.
Similarly, a construction fleet operating around project cycles may experience larger utilization changes than a scheduled distribution fleet.
Instead of copying a generic industry percentage, establish a baseline for comparable vehicles inside your own operation and then investigate meaningful differences.
This gives fleet managers a more useful question:
Why is this vehicle consistently being used less than comparable vehicles performing the same job?
Why Fleet Utilization Can Be Low
Low utilization does not automatically mean the fleet has too many vehicles.
Several operational problems can produce the same result.
Too Many Vehicles for Current Demand
If capacity has grown faster than workload, some vehicles may regularly remain unused.
This can occur after:
- Demand changes
- Lost contracts
- Seasonal reductions
- Route consolidation
- Business restructuring
Uneven Vehicle Assignment
Some dispatch teams repeatedly assign familiar vehicles while other suitable assets remain unused.
Over time, this creates:
- Uneven mileage
- Uneven engine hours
- Uneven maintenance requirements
- Premature wear on heavily used vehicles
Excessive Downtime
A vehicle cannot contribute useful work while repeatedly unavailable.
Preventive servicing, maintenance planning and earlier identification of recurring issues can help protect usable capacity.
Your fleet preventive maintenance guide explains this area in more detail.
Excessive Waiting
Vehicles may spend significant portions of their working day waiting at:
- Loading points
- Warehouses
- Customer sites
- Project gates
- Dispatch yards
- Fuel stations
The vehicle may technically be deployed but still produce less useful work than expected.
Too Much Idle Time
Engine-on stationary time can increase engine hours without increasing productive distance.
This is why utilization data becomes more useful when reviewed alongside fleet idle time.
Poor Route or Dispatch Planning
A vehicle may spend too much time:
- Repositioning
- Travelling empty
- Waiting between jobs
- Returning unnecessarily to base
- Covering work that could have been assigned differently
India’s freight environment also illustrates why operational efficiency matters. NITI Aayog’s national freight assessment identified issues including low operational efficiency and empty running within road freight operations. NITI Aayog
Vehicle-Job Mismatch
Sometimes a vehicle remains underused because it does not suit current work.
Examples include:
- Vehicle capacity is larger than required
- Body type does not match customer requirements
- Equipment is located at the wrong branch
- Asset specifications limit where it can operate
This is an allocation issue rather than simply a demand issue.
How Telematics Helps Measure Vehicle Utilization
Manual utilization calculations are possible, but connected vehicle data can make the measurement more consistent.
A telematics device can provide operational data such as:
- GPS movement
- Trip history
- Ignition status
- Engine hours
- Stops
- Idle time
- Distance
- Geofence activity
- Supported vehicle information
The important point is not merely collecting these data points.
They need to be combined with operational context.
For example:
A GPS record may show a vehicle stationary for three hours.
That alone does not tell you whether the vehicle was:
- Waiting unnecessarily
- Undergoing maintenance
- Loading cargo
- Performing work at a customer site
- Operating stationary equipment
Telematics provides evidence.
Fleet processes provide the context needed to interpret it.
Data to Review When Measuring Fleet Utilization
Utilization becomes much more useful when reviewed with a small set of supporting measures.
Productive Hours
How much time was actually spent performing defined useful work?
Available Hours
How much capacity was available for use?
Engine Hours
Useful for equipment and vehicles where mileage does not represent workload accurately.
Active Days
How many days during the period was the vehicle actually assigned?
Trips
How frequently is the asset being used?
Distance
Useful for road-based operations, provided productive and non-productive movement can be understood.
Idle Time
Helps distinguish engine activity from actual productive work.
Downtime
Shows whether low utilization is caused by lack of demand or lack of availability.
Cost
An underused vehicle can look very different when fixed and variable costs are considered.
Your fleet cost per kilometer guide can be used alongside utilization analysis to understand cost performance.
How to Identify Underused Fleet Vehicles
Do not classify a vehicle as underused because of one slow day.
Use trends.
Step 1: Group Comparable Vehicles
Compare assets performing similar work.
Avoid comparing:
- A backup vehicle with a primary route vehicle
- An excavator with a tipper
- A city van with a long-haul truck
Step 2: Choose a Consistent Measurement Period
Weekly data may identify short-term operational issues.
Monthly data is generally better for identifying persistent patterns.
Longer periods may be required for seasonal fleets.
Step 3: Compare Actual Utilization With Internal Expectations
Look for vehicles that consistently operate below similar assets.
Step 4: Investigate the Reason
Ask:
- Is there enough work?
- Is the vehicle regularly unavailable?
- Is dispatch overlooking it?
- Is it located in the wrong place?
- Is it unsuitable for current work?
- Is waiting time reducing productivity?
- Is the measurement method incorrect?
Step 5: Act on the Cause
Do not jump directly from “low utilization” to “remove the vehicle.”
The correct action depends on why utilization is low.
How to Improve Fleet Utilization
Improving vehicle utilization is primarily an operational exercise.
The objective is to get more useful work from existing capacity without creating unnecessary pressure on vehicles, drivers or maintenance operations.
1. Establish a Reliable Baseline
Before changing anything, measure current utilization using a consistent definition.
Record:
- Available time
- Productive time
- Active days
- Trips
- Distance
- Engine hours where relevant
- Idle time
- Downtime
A baseline makes it possible to verify whether later changes actually improve performance.
2. Balance Work Across Similar Vehicles
Look for situations where some vehicles accumulate significantly more work than others.
Where practical, redistribute assignments.
Better workload balance can help avoid a situation where one vehicle receives excessive mileage while another remains parked.
3. Reduce Avoidable Waiting
Use trip, stop and location information to identify recurring delays.
For example:
If multiple trucks repeatedly spend long periods at the same loading location, the problem may not be vehicle utilization itself.
The real issue may be:
- Loading capacity
- Scheduling
- Yard congestion
- Documentation
- Customer processing
Correcting the process can improve productive vehicle time.
4. Improve Dispatch Decisions
A dispatcher needs more than a list of vehicles.
Useful information may include:
- Current location
- Vehicle status
- Availability
- Vehicle type
- Existing assignment
- Maintenance status
A connected Fleet Management System can help bring relevant operating information into one view.
5. Reduce Preventable Downtime
Repeated breakdowns reduce the usable capacity of the fleet.
Review:
- Maintenance history
- Service intervals
- Engine hours
- Mileage
- Recurring faults
The objective is not simply to perform more maintenance.
It is to improve maintenance timing so vehicles are available when required.
6. Review Idle and Stationary Time
Do not automatically classify every stationary period as wasted time.
Instead, separate:
Productive stationary activity
from
avoidable waiting or idling
This distinction is especially important for construction, service and specialized fleets.
7. Reposition Assets When Demand Changes
A vehicle can be underused at one depot while another location lacks capacity.
Compare utilization between:
- Branches
- Depots
- Project sites
- Regions
Moving suitable assets may be more practical than immediately acquiring additional vehicles.
8. Review Fleet Size Only After Understanding the Data
Persistent low utilization may indicate excess capacity.
However, before reducing the fleet, consider:
- Peak demand
- Seasonal workload
- Maintenance reserve
- Emergency coverage
- Specialized requirements
- Contract commitments
A fleet that appears oversized during an average week may still need reserve vehicles during peak operations.
9. Measure the Result
After making changes, calculate utilization again using the same methodology.
Otherwise, the before-and-after numbers cannot be compared reliably.
Why 100% Utilization Should Not Be the Automatic Goal
A fleet utilization dashboard may make a higher percentage look automatically better.
Operationally, that is too simplistic.
A fleet still needs room for:
- Preventive maintenance
- Inspections
- Demand variation
- Unexpected replacements
- Driver schedules
- Vehicle rotation
- Emergency requirements
If every suitable vehicle is continuously committed, a single breakdown or demand spike may create operational disruption.
The better objective is:
Enough utilization to avoid unnecessary idle capacity, with enough availability and reserve to maintain reliable operations.
Common Fleet Utilization Measurement Mistakes
Using 24 Hours as Available Time for Every Vehicle
If the fleet operates one scheduled shift, 24 hours may not represent real usable capacity.
Treating Engine-On Time as Productive Time
An engine can run while a vehicle is stationary and producing no useful work.
Treating All Stationary Time as Unproductive
The opposite mistake also occurs.
Service vehicles and equipment can perform useful work without moving.
Comparing Different Vehicle Types
Utilization should normally be compared within meaningful operational groups.
Looking Only at Fleet Average
An acceptable average can conceal heavily overused and severely underused vehicles.
Changing the Formula Every Month
If definitions change constantly, trends lose meaning.
Document the calculation method and use it consistently.
Chasing a Generic Benchmark
An external percentage may not reflect your:
- Operating hours
- Fleet type
- reserve requirements
- maintenance strategy
- demand pattern
Your own comparable historical data is often more useful for day-to-day fleet decisions.
A Simple 30-Day Fleet Utilization Review
You do not need a large transformation project to start improving utilization.
Week 1 — Define and Measure
Define:
- What counts as available
- What counts as productive
- Which vehicle groups should be compared
- Which utilization formula will be used
Calculate a baseline.
Week 2 — Investigate Exceptions
Identify:
- Underused vehicles
- Heavily used vehicles
- High-wait locations
- Assets with excessive downtime
- Unbalanced branches or depots
Week 3 — Make Targeted Changes
Possible actions include:
- Reassign vehicles
- Adjust dispatch rules
- Reduce recurring waiting
- Address maintenance issues
- Move assets between locations
Week 4 — Measure Again
Compare the new period with the baseline.
The objective is not simply to make the percentage larger.
The objective is to understand whether the fleet is producing more useful work from appropriate available capacity.
Using Fleet Utilization With Other KPIs
Fleet utilization should not be managed in isolation.
Combine it with measures such as:
- Availability
- Downtime
- Idle time
- Engine hours
- Distance
- Fuel consumption
- Maintenance activity
- Cost per kilometre
For example:
Low utilization + high availability may indicate excess capacity or poor deployment.
Low utilization + low availability may point toward maintenance or reliability issues.
High utilization + rising downtime may indicate that assets are being worked heavily without enough maintenance flexibility.
This is why utilization is most useful as part of a broader fleet-performance framework rather than as a standalone score.
Frequently Asked Questions
What is fleet utilization rate?
Fleet utilization rate measures how much of the available capacity of vehicles or equipment is actually used for productive activity during a defined period.
What is the fleet utilization formula?
A common time-based calculation is:
Fleet Utilization Rate (%) = Productive Hours ÷ Available Hours × 100
The fleet should clearly define productive and available time before using the formula.
What does a 75% fleet utilization rate mean?
Using a time-based method, 75% utilization means that three-quarters of the defined available operating time was used for productive activity during the measurement period.
What is a good fleet utilization rate?
There is no single percentage that is appropriate for every fleet. The target depends on vehicle type, workload, operating schedule, maintenance needs, seasonal demand and reserve requirements.
Can GPS tracking measure vehicle utilization?
GPS information can support utilization analysis by showing movement, trips, distance, stops and locations. However, GPS movement alone may not accurately represent productive work for every type of vehicle.
Can telematics improve fleet utilization?
Telematics can provide vehicle activity, engine hours, idle time, trips, locations and other supported data that helps fleet managers identify underused assets and operational bottlenecks. Improvement still depends on how the fleet acts on that information.
Why can a vehicle be available but not utilized?
A vehicle may be mechanically ready for work but receive no assignment because of low demand, poor dispatching, incorrect location, unsuitable specifications or excess fleet capacity.
How often should fleet utilization be reviewed?
Operational teams may monitor utilization regularly, while weekly and monthly comparisons can help identify trends. The appropriate review period depends on how frequently fleet demand changes.
Conclusion
Fleet utilization rate helps fleet managers move beyond simply counting vehicles and start understanding how effectively available assets are being used.
The formula is straightforward.
The quality of the result depends on how carefully the fleet defines productive use and available capacity.
A strong utilization process should therefore follow this sequence:
Define → Measure → Compare → Investigate → Improve → Verify
Use vehicle-level data to find exceptions.
Compare similar assets rather than unrelated vehicles.
Separate productive stationary work from avoidable waiting.
Review utilization alongside availability, maintenance, idle time and operating cost.
Most importantly, do not treat the highest possible percentage as the goal.
The goal is to maintain the right level of vehicle use for reliable, efficient and sustainable fleet operations.
Improve Fleet Utilization with Better Operational Visibility
Knowing which vehicles are moving is only the beginning.
Diselmap helps fleet teams connect GPS tracking, vehicle activity, telematics, engine information and operational data so managers can better understand how vehicles are being used across routes, depots and worksites.
Use connected fleet data to identify underused assets, investigate excessive waiting, compare vehicle activity and support more informed deployment decisions.